Understanding Data Types and Measurement Scales
Often data visualization is interpreted as just visualizing data effectively. However, it is much more than just creating visually-appealing graphs/charts. Before giving your data a voice, you need to understand the different data types you'll be dealing with in order to decide the best chart type for your data.
In this blog post, you'll learn about the different types of data and their measurement scales.
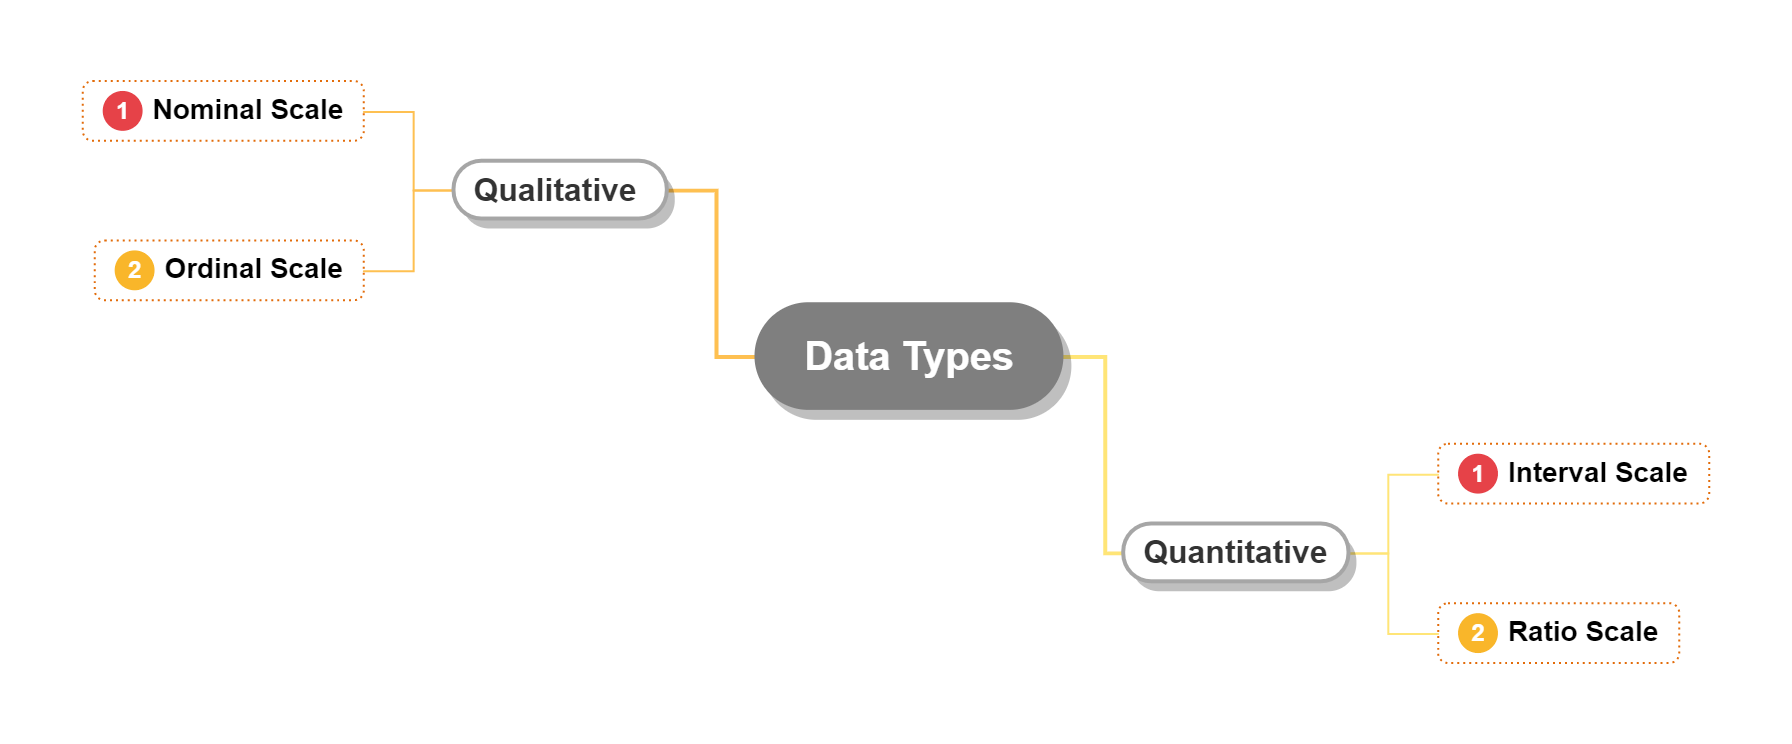
Data Types
1. Qualitative Data - Any information that is non-numerical in nature is termed as Qualitative Data. This type of data is categorized based on attributes, properties, and labels and describes information in the form of open-ended answers allowing the respondents to express themselves.
2. Quantitative Data - Any information whose value is measured in the form of numbers is termed as Quantitative Data. This data type can likewise be characterized as a group of quantifiable information that can be used for numerical calculations and statistical analysis, influencing real-life decisions.
Measurement Scales
In Statistics, the numbers or variables are defined and categorized using different measurement scales. Each measurement scale has a specific property that helps to interpret the numbers assigned to people, phenomenon, objects, and events.
There are 4 measurement scales:
1. Nominal Scale - Data Type : Qualitative
Nominal Scale is a measurement scale where numbers are served as "labels" to identify and classify an object. This type of scale does not require the use of numerical values or order.
Examples of Nominal Scale -
a. Gender : Male, Female
b. Eye Color : Black, Brown, Blue
c. Pet : Cat, Dog, Fish
Characteristic of Nominal Scale -
Nominal data can be quantitative as well. For example, zip code. However, the quantitative labels lack a relationship and mathematical operations cannot be performed on them.
How to analyze nominal data?
To analyze nominal data, you can use the grouping method. The nominal variables are grouped and classified into various categories, and for each category, the frequency (mode) or percentage can be calculated. The bonus point is you can apply statistical methods to analyze nominal data. For example, you can analyze this type of data using hypothesis testing i.e. using Chi-Square test. After conducting the analysis, nominal data can be graphically represented using bar chart or pie chart.
2. Ordinal Scale - Data Type : Qualitative
Ordinal Scale is a measurement scale where the order of the variables matter but not the difference between each of these variables.
Examples of Ordinal Scale -
a. Socio-Economic Background : Upper Middle Class, Lower Middle Class
b. Class Ranking : 1st, 2nd, 3rd
c. Frequency of Occurrence : Always, Very Often, Sometimes, Rarely, Never
Characteristics of Ordinal Scale -
a. Ordinal Scale helps surveyors analyze the degree of agreement/disagreement among respondents with respect to the identified order of the variables.
b. This type of scale has no zero point i.e. it is either arbitrary or absolute.
How to analyze ordinal data?
The simplest way to analyze ordinal data is to present it in tabular format in which each row indicates a distinct category. However, to compare two ordinal groups, you should use the Mann-Whitney U test. This test helps us to analyze if a variable from one sample is greater or lesser than another variable randomly selected from a different sample.
3. Interval Scale - Data Type : Quantitative
Interval Scales are numeric scales in which there is order and the difference between two values is equal and meaningful.
Examples of Interval Scale -
a. Temperature : Fahrenheit, Celsius
b. Credit Score : 300-850
c. Measuring income as a range : $0-$999, $1000-$1999, etc.
Characteristic of Interval Scale -
Arithmetic operations like addition and subtraction can be performed on interval data. However, mathematical operations like multiplication or division cannot be applied on interval data.
How to analyze interval data?
Since interval data is quantitative in nature, almost all statistical analysis can be applied when calculating interval data. Some of them are mean, median, mode, standard deviation, trend analysis, conjoint analysis, SWOT (Strengths, Weaknesses, Opportunities and Threats) analysis, and TURF (Total Unduplicated Reach and Frequency) analysis.
4. Ratio Scale - Data Type : Quantitative
Ratio Scales are created by units of equal size, same as an interval scale with the added condition that "zero" is not arbitrary. In simple words, it is an interval scale with a true "zero".
Examples of Ratio Scale -
a. Age : Less than 20, 21-30, 31-40, etc.
b. Weight in Pounds : Less than 60, 61-120, 121-160, etc.
c. Height : Less than 5 feet, 5 feet 1 inch - 5 feet 5 inches, etc.
Characteristics of Ratio Scale -
a. Ratio Scale can be measured, ranked, and ordered.
b. Data can be added, subtracted, multiplied or divided.
How to analyze ratio data?
Any type of statistical tests i.e. either parametric or non-parametric test can be performed on ratio data since it allows all mathematical operations. However, parametric tests are more powerful because it allows you to make stronger conclusions.
I hope this blog post helped you discover the different data types and the statistical measurement scale you can use at each data type.