Popcorn Rankings
When the NBA all-star, Stephen Curry is not playing basketball, you may find him savoring a bowl full of popcorn.
For the purity of the pastime, Curry said, he never adds anything to the popcorn to change its appearance, taste or temperature. His devotion towards popcorn has only grown deeper over time and he has maintained his own "power rankings" of the popcorn offering at all 29 NBA arenas. He has ranked he popcorn at all 29 NBA arenas based on 5 factors: Freshness, Crunchiness, Saltiness, Butter, and Presentation.
The visual below in the form of Radar chart displays these rankings based on these 5 factors.
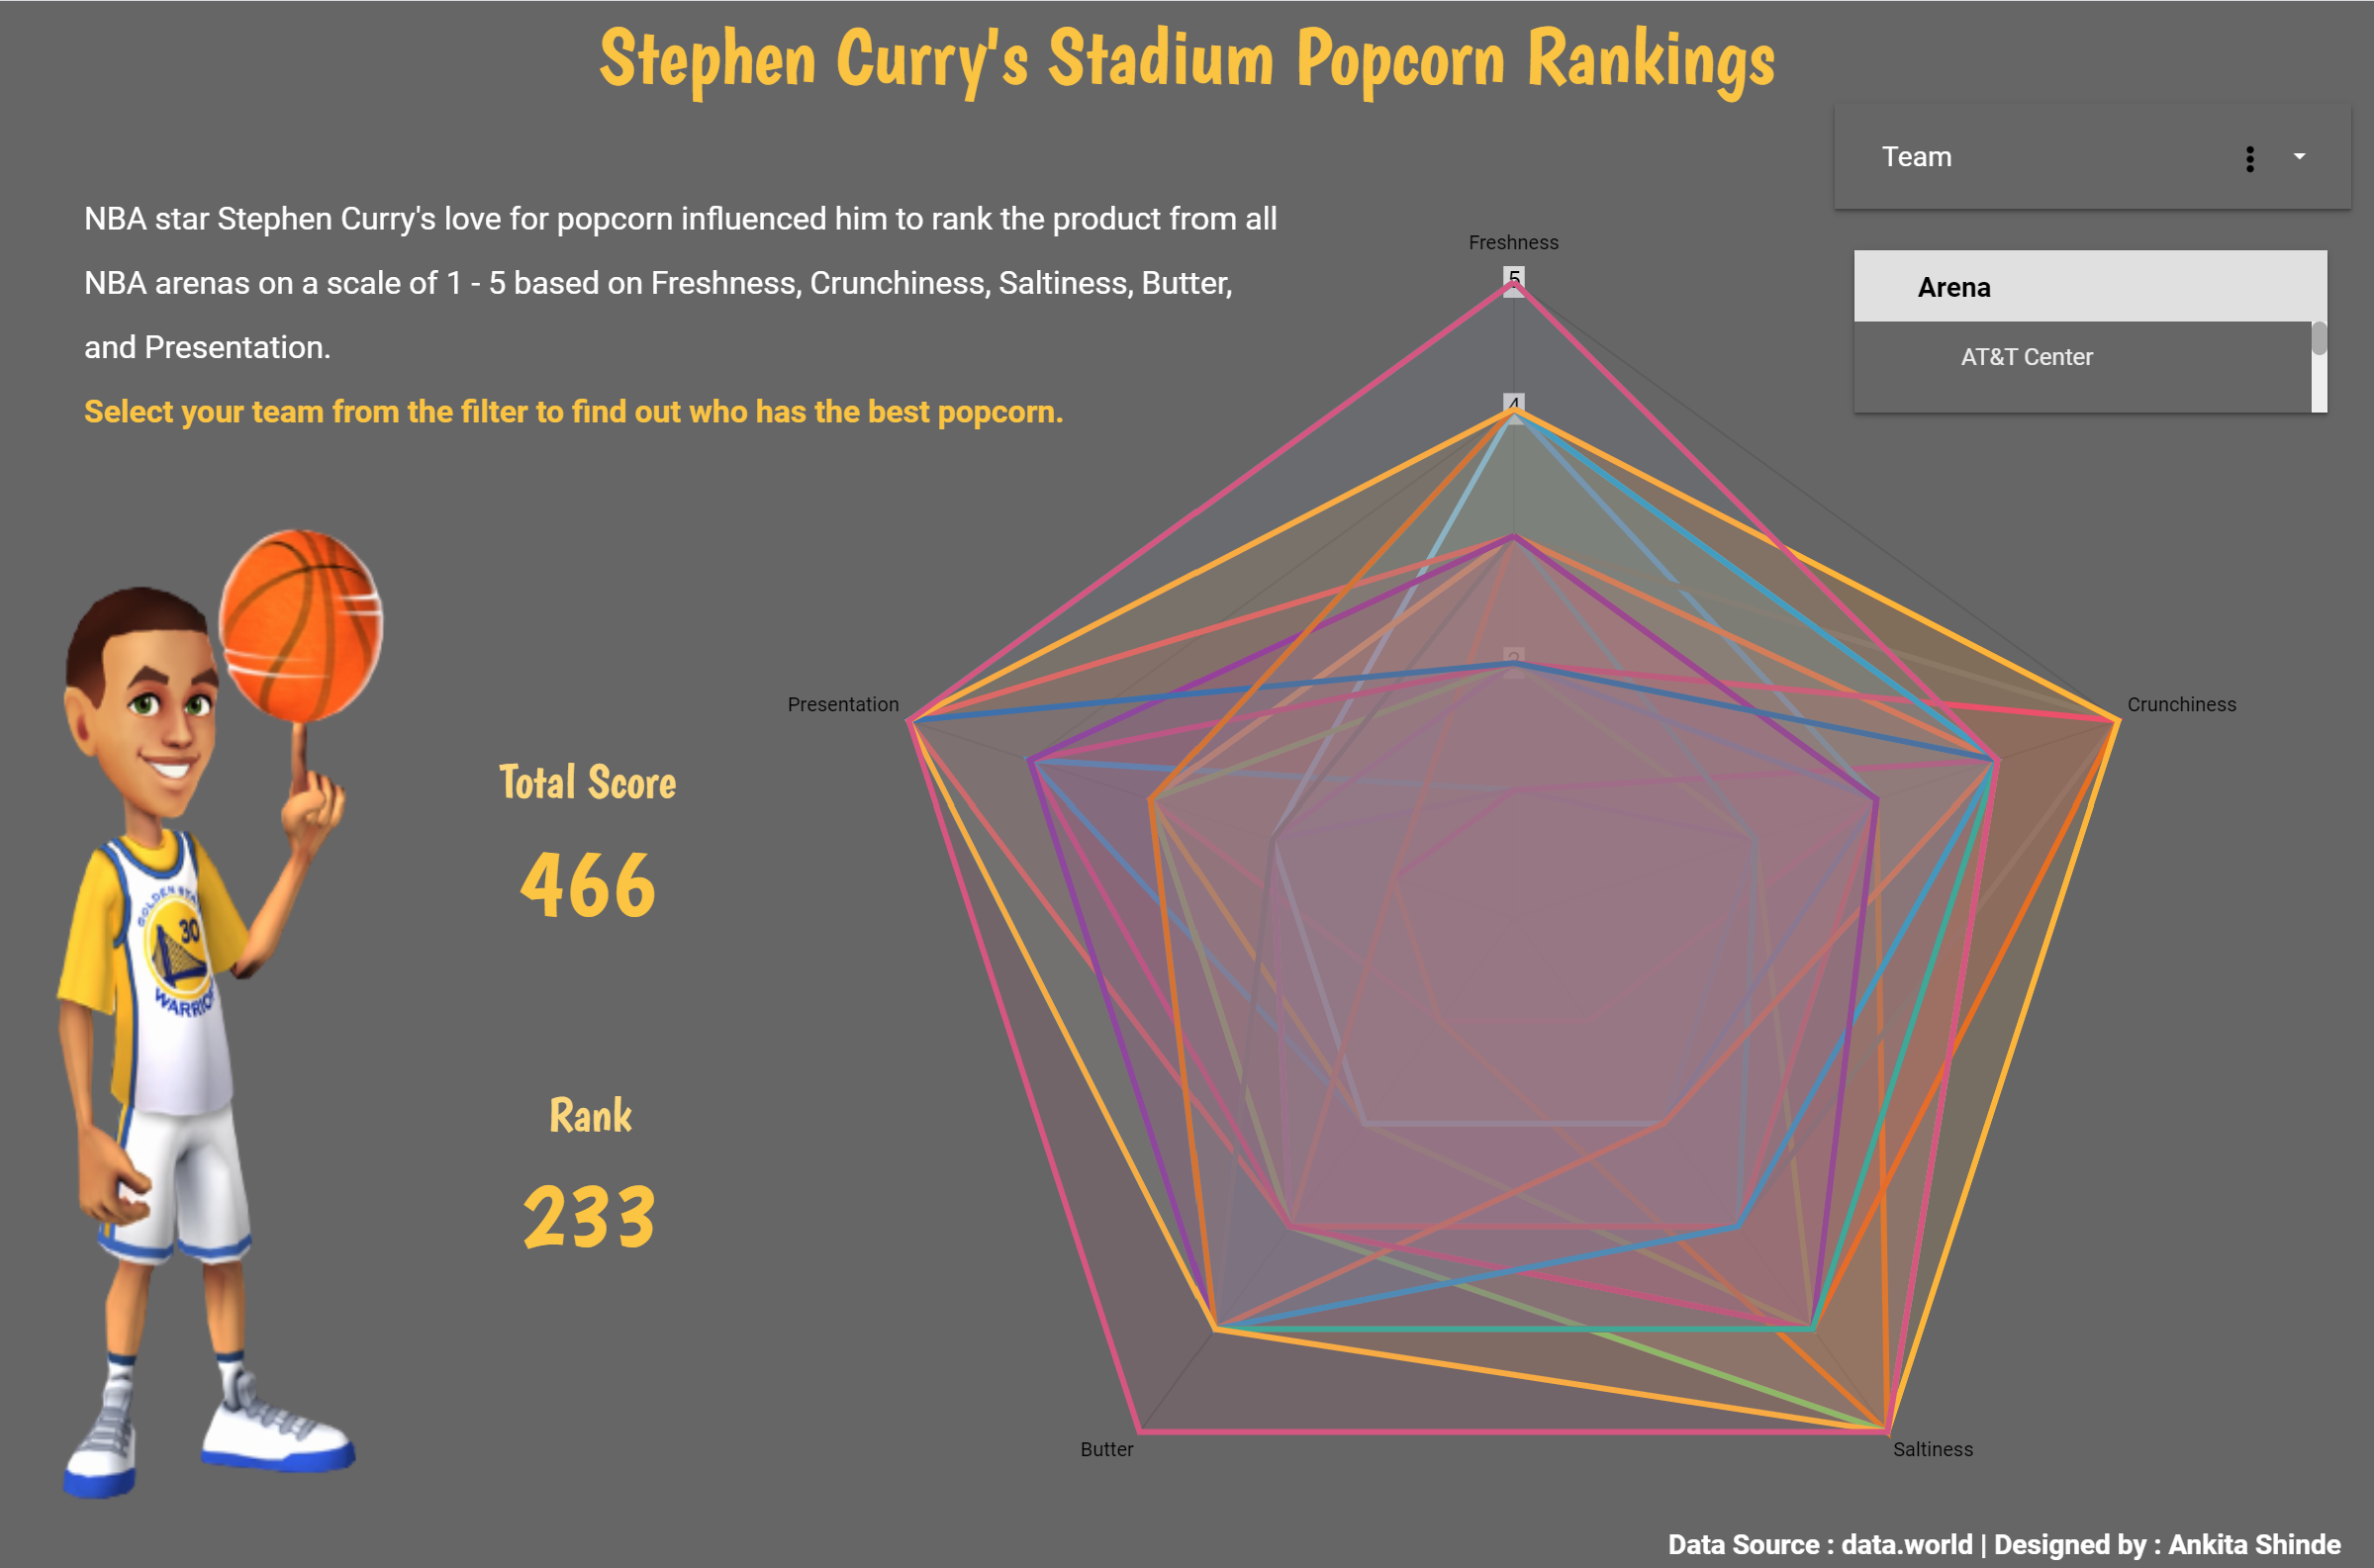
The main purpose of using Radar chart for displaying scores is:
- It helps to plot many variables/characteristics on one graph and then connect each one to create a polygonal shape that represents the group. This helps in seeing which characteristics are scoring high or low within a dataset, making them ideal for displaying performance.
- We can quickly identify the outliers since the point of the outlier will not align with other variables on the chart.