Global GHG Emissions
Greenhouse gas emissions are gases that trap heat within earth’s atmosphere by absorbing energy and preventing heat from escaping into space. They do not include natural sources like volcanic eruptions or biological processes.
Greenhouse emissions have grown by 41% since 1990, and are still rising rapidly. This trend was assessed at the 95% confidence level. Our world emits close to 50 billion tonnes of greenhouse gases every year. To reduce this emission, we need to know where these emissions are coming from and which sector is contributing the most?
This interactive visual in the form Sunburst chart looks into the breakdown of emissions by sector in 2016. In this visual, the origin which is the "sector" is represented by the center of the circle and each level of the "sector" by an additional ring.
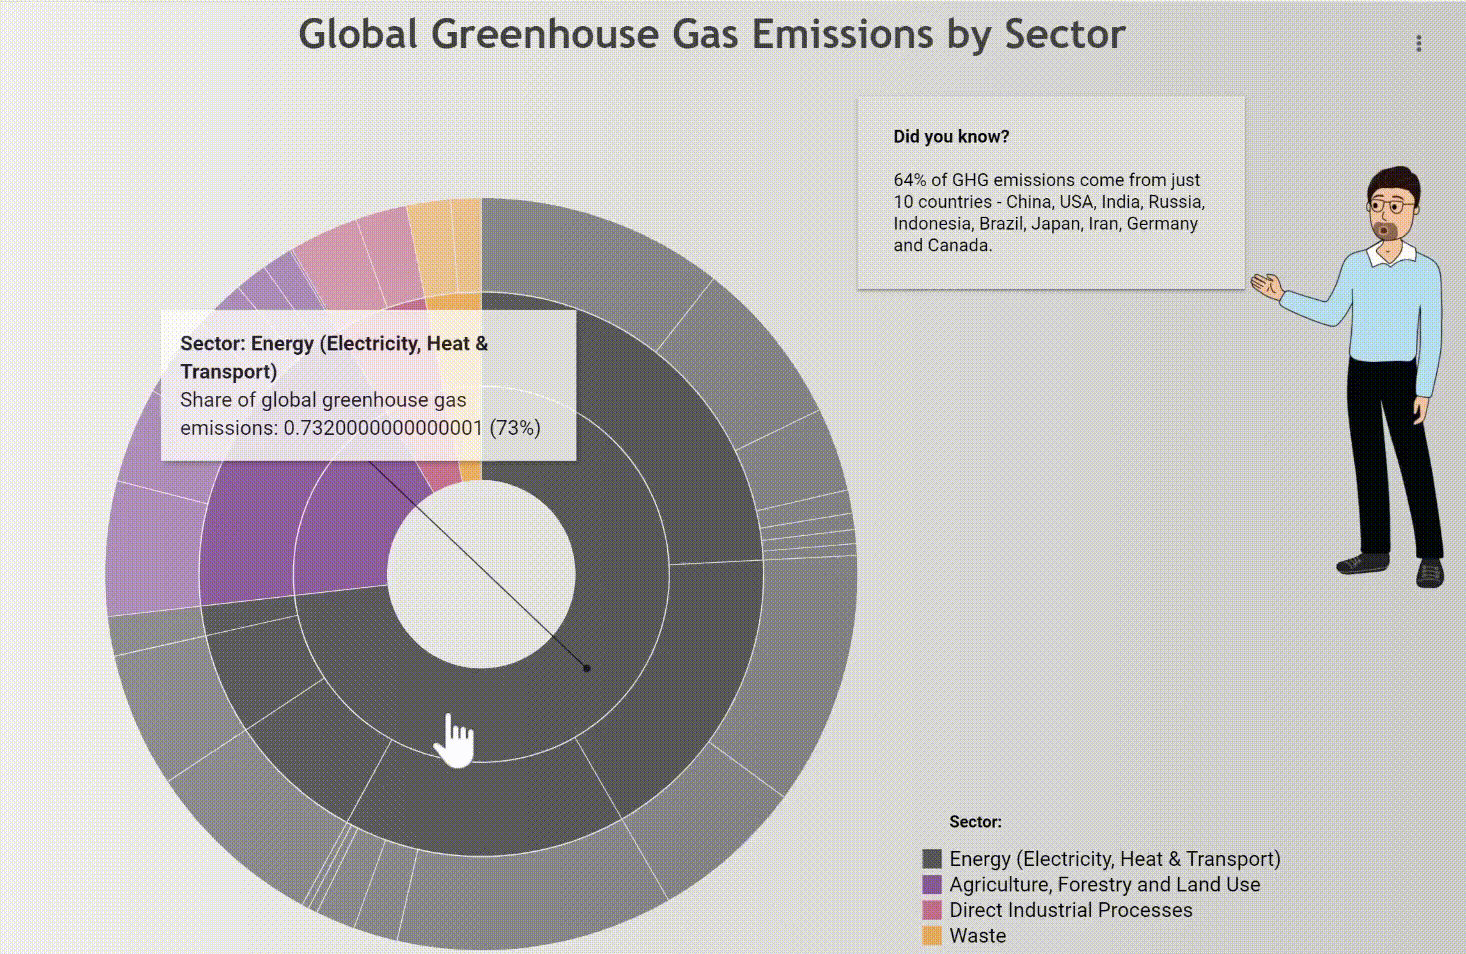
Based on this chart, it is evident that almost 73% emissions come from energy usage, 20% come from agriculture and land and the remaining 7% from industry and waste. It is obvious from this breakdown that various sectors are contributing towards greenhouse emissions. This implies there is no simple solution to tackle environmental change even if we focus on power, transport, food, and deforestation.
View the interactive visualization here.